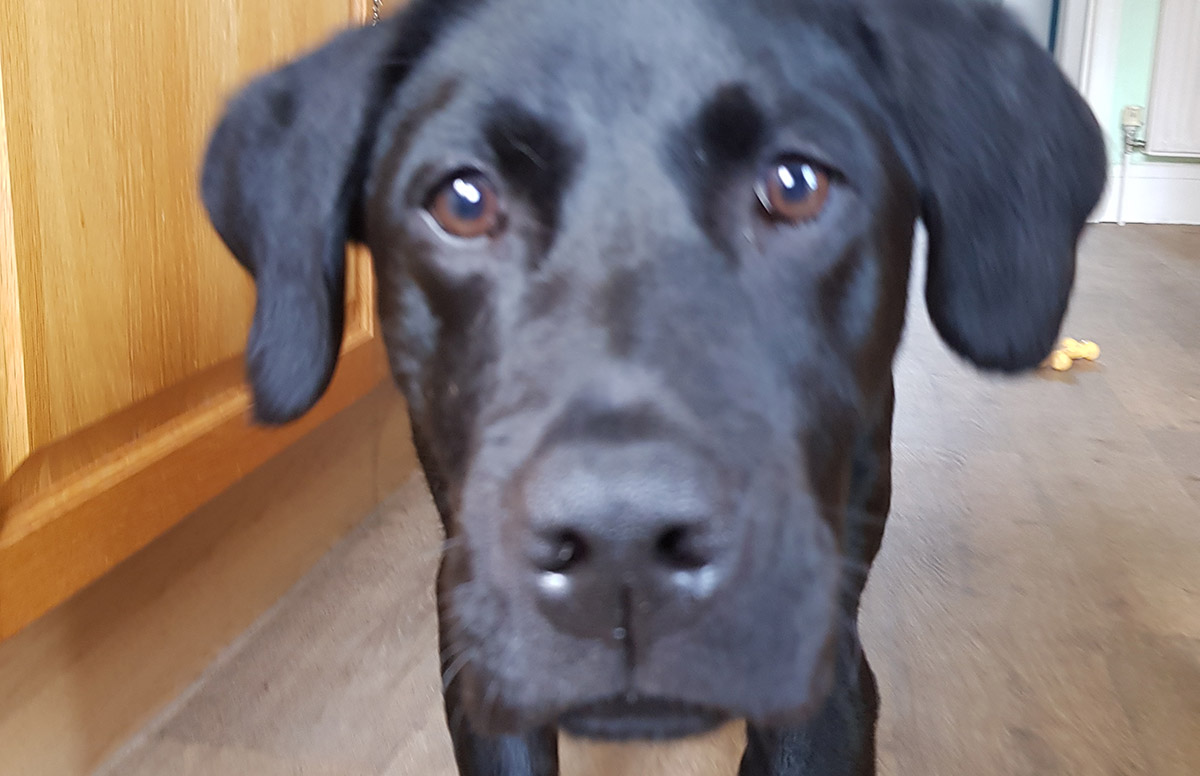
We’ve got a puppy.
I don’t think I mentioned this anywhere on here formally, although my Instagram feed has been fairly clear on this of late and a brief tag search here will verify this.
When we first collected him, he was very small indeed.

Since then, he’s proven to be an enthusiastic consumer of food (which he DIDN’T learn from me, thankyou), and has grown at what I think is a fairly hefty pace.


(those photos were taken on Dec 30th and March 11th)
We’ve been getting him weighed whenever we’ve gone to the vet, and I did a little bit of spreadsheeting, and figured out that if he kept growing at the rate he currently was, then by June 2019 he’d weigh the same as a Volkswagen Beetle. Which seemed an amusing enough thing to be able to tell people.

But me being me I thought the most fun way to illustrate this would be to have a dynamic graph on a website somewhere. Y’know, evidence-based approach, and all that. So I did a bit of fannying about and came up with the following:
If you click on the greyed out fields in the legend it should show Larry’s growth trend line, and also the intersection point between it, and the base curb weight of a 2018 Volkswagen Beetle (3020 lb).
Now. The more astute among my readers (and I’m dearly hoping the chart tool works in mobile browsers now) will have spotted that in fact the intersection does NOT happen in June 2019. Rather in fact as I write this it happens some time in August 2058. Given the typical lifespan of a labrador, it’s fair to say that this is no longer an eventuality we need to seriously plan for.
It does, how ever, leave me wondering how in the hell I came to that conclusion in the first place. I promise I wasn’t making it up! But it didn’t seem important enough to save the spreadsheet at the time.
The only thing I can think of is that Larry’s growth was exponential to start with, so at around 6kg when we first collected him and then hitting 12kg in early February, I must have figured that he’d double in size every 2 months. (And through the magic of technology I’ve now added that as a data series to the graph, proving that this is indeed the nonsense I was propagating – although I don’t really know how to do logarithmic trend lines, so it’s a little rough and hard to make sense of)
Anyway, here he is now:

And I’ve linked to the graph in the menu bar for ease of keeping tabs on him. Aren’t I wonderful.
* Yes, I know – he’s not a hound, he’s a retriever. I apologise deeply for any inconvenience this may cause you.


